考试报名
考试报名
考试内容
考试大纲
在线客服
返回顶部

备考刷题,请到

CDA认证小程序

The following diagram is a loyalty model for a certain e-commerce platform. Please answer the following question: 
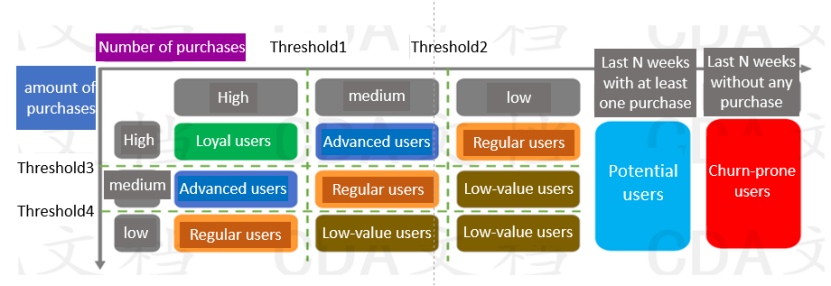
The user's behavior continuously influences their classification. If you want to know how many users from other categories have transitioned into loyal users, what type of chart can be used to present this information?
A. Clustered bar chart
B. Waterfall chart
C. Funnel chart
D. Pie chart
上一题
下一题
收藏
点赞
评论
题目解析
题目评论(0)

A waterfall chart shows how business results are influenced by different stages of business behavior.

正确答案是B: Waterfall chart。

专业分析:

Waterfall chart(瀑布图)是一种非常适合展示数据增减变化的图表类型。它能够清晰地显示出数据的起点、各个阶段的增减变化以及最终的结果。在用户分类的转变过程中,瀑布图可以展示从其他类别转变成忠实用户的数量变化,清晰地显示每一步的累积效果。

以下是对其他选项的分析:
- A: Clustered bar chart(簇状条形图)主要用于对比多个类别的数据,但不适合展示数据的增减变化过程。
- C: Funnel chart(漏斗图)主要用于展示逐步减少的过程,如销售漏斗或转化漏斗,不适合用于展示用户分类的转变。
- D: Pie chart(饼图)主要用于展示数据的组成部分占整体的比例,不适合展示动态变化的过程。

因此,瀑布图是最适合用于展示从其他类别转变成忠实用户的数量变化的图表类型。